
現貨供應最新開發模組
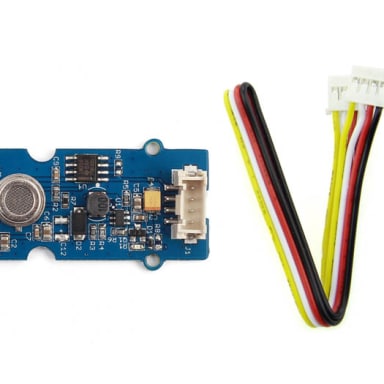
Grove - GSR 皮膚電導、情緒變化(如測謊)、或睡眠質量感測器


資料來源:https://www.seeedstudio.com/Grove---GSR-sensor-p-1614.html
Description
GSR stands for galvanic skin response, is a method of measuring the electrical conductance of the skin. Strong emotion can cause stimulus to your sympathetic nervous system, resulting more sweat being secreted by the sweat glands.
Grove - GSR allows you to spot such strong emotions by simple attaching two electrodes to two fingers on one hand. It an interesting gear to create emotion related projects like sleep quality monitor.
Note: This device is not medical device.
Features
Detects conductance of skin
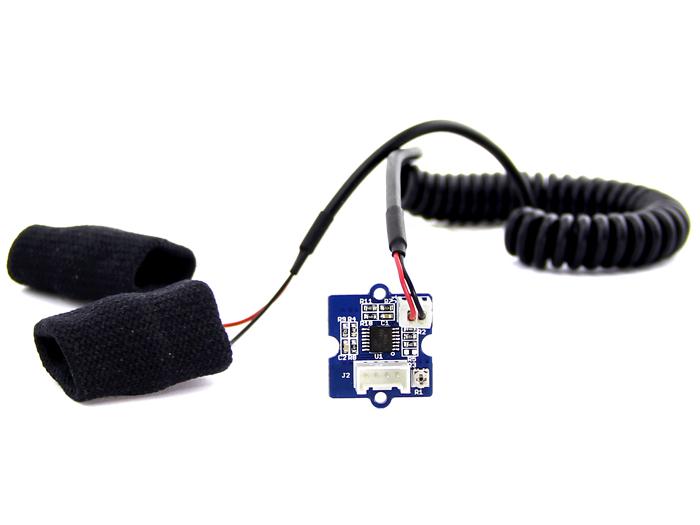
Finger Straps for electrodes
For all Grove users (especially beginners), we provide you guidance PDF documents. Please download and read through Preface - Getting Started and Introduction to Grove before your using of the product.
Technical Details
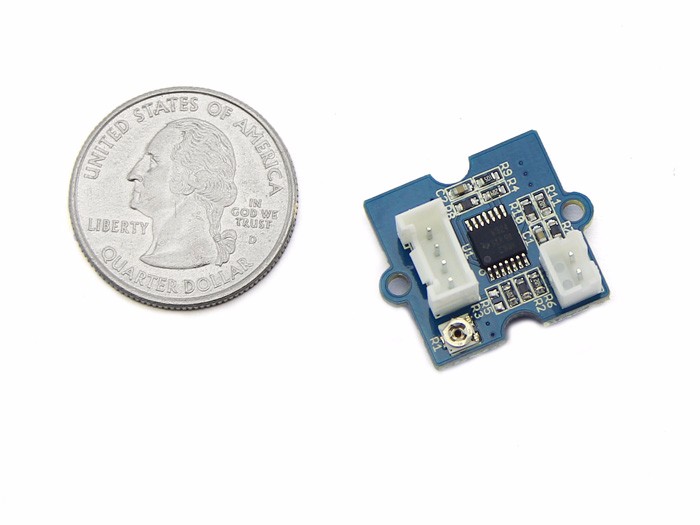
| Dimensions | 24mm x 20mm x 9.8mm |
| Weight | G.W 29g |
| Battery | Exclude |
| Input Voltage | 5V/3.3V |
| Sensitivity adjustable via a potentiometer | |
Part List
| Grove - GSR Sensor | 1 |
Documents


資料來源:http://wiki.seeedstudio.com/wiki/Grove_-_GSR_Sensor_传感器
Introduction
3.3V 5.0V Digital
GSR, standing for galvanic skin response, is a method of measuring the electrical conductance of the skin. Strong emotion can cause stimulus to your sympathetic nervous system, resulting more sweat being secreted by the sweat glands. Grove – GSR allows you to spot such strong emotions by simple attaching two electrodes to two fingers on one hand, an interesting gear to create emotion related projects, like sleep quality monitor.

Version
| Product | Released Date | Description |
|---|---|---|
| Grove - GSR_Sensor V1.0 | June 19, 2013 | Initial |
| Grove - GSR_Sensor V1.2 | July 31, 2014 | Add C3 100nf between M324PW-TSSOP14 and GND |
Specifications
- Input Voltage: 5V/3.3V
- Sensitivity adjustable via a potentiometer
- External measuring finger cots
Tip
More details about Grove modules please refer to Grove System
Platforms Supported
| Arduino | Wio | BeagleBone | Raspberry Pi | LinkIt ONE |
|---|---|---|---|---|
Caution
The platforms mentioned above as supported is/are an indication of the module's hardware or theoritical compatibility. We only provide software library or code examples for Arduino platform in most cases. It is not possible to provide software library / demo code for all possible MCU platforms. Hence, users have to write their own software library.
Getting Started
Connection
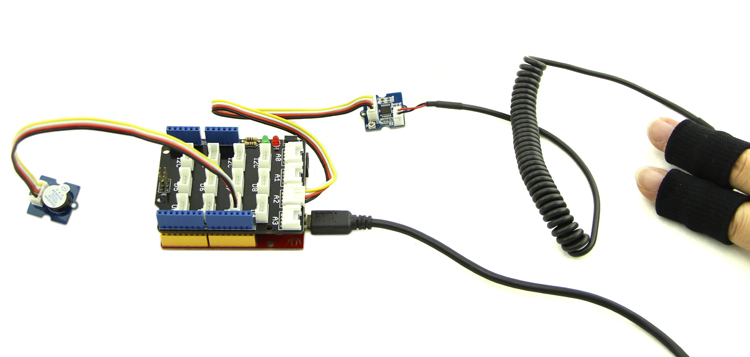
Here we will show you how this Grove - GSR works via a simple demo. First of all, we need to prepare the below stuffs:
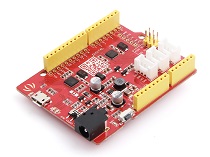
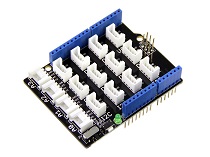
| Seeeduino V4 | Grove - GSR | Base Shield | Grove-RGB LCD Backlight | Grove-Buzzer |
|---|---|---|---|---|
 |
 |
 |
 |
 |
| Get ONE Now | Get ONE Now | Get ONE Now | Get ONE Now | Get ONE Now |
- Connect the Grove-GSR to A2 on the Grove - Base Shield by using a Grove Universal 4 pin cable.
- Connect the Grove-Buzzer to D3 on the Grove - Base Shield by using a Grove Universal 4 pin cable.
- Connect the Grove-RGB LCD Backlight to I2C on the Grove - Base Shield by using a Grove Universal 4 pin cable.
- Plug the base Shield into Seeeduino-V4.
- Connect Seeeduino-V4 to PC by using a USB cable.

Note
If you don’t have a Base Shield, don’t worry, the sensor can be connected to your Arduino directly. Please follow below tables to connect with Arduino.
| Grove-GSR Sensor | Arduino |
|---|---|
| GND | GND |
| VCC | VCC |
| SIG | A2 |
| NC | No connection |
| Grove-Buzzer | Arduino |
|---|---|
| GND | GND |
| VCC | VCC |
| SIG | 3 |
| NC | No connection |
| Grove - LCD RGB Backlight | Arduino Uno |
|---|---|
| GND | GND |
| VCC | VCC |
| SDA | A4 |
| SCL | A5 |
As a reference the table below shows where I2C pins are located on various Arduino boards.
| Board | I2C pins |
|---|---|
| Uno, Ethernet | A4 (SDA), A5 (SCL) |
| Mega2560 | 20 (SDA), 21 (SCL) |
| Leonardo | 2 (SDA), 3 (SCL) |
| Due | 20 (SDA), 21 (SCL), SDA1, SCL1 |
Software
We need to download Grove_LCD_RGB_Backlight library and install to your Arduino IDE.
- Please follow how to install an arduino library procedures to install LCD RGB Backlight library.

- Copy and paste the code below to a new Arduino sketch and upload it to Arduino.
#include <Wire.h>
#include "rgb_lcd.h"

    const int BUZZER=3;
    const int GSR=A2;
    int threshold=0;
    int sensorValue;
    rgb_lcd lcd;

    void setup(){
      long sum=0;
      lcd.begin(16, 2);
      Serial.begin(9600);
      pinMode(BUZZER,OUTPUT);
      digitalWrite(BUZZER,LOW);
      delay(1000);

      for(int i=0;i<500;i++)
      {
      sensorValue=analogRead(GSR);
      sum += sensorValue;
      delay(5);
      }
      threshold = sum/500;
       Serial.print("threshold =");
       Serial.println(threshold);
      }

    void loop(){
      int temp;
      sensorValue=analogRead(GSR);
      Serial.print("sensorValue=");
      Serial.println(sensorValue);
      lcd.setCursor(0, 0);
      lcd.print("GSR Value: ");
      lcd.print(sensorValue);
      temp = threshold - sensorValue;
      if(abs(temp)>50)
      {
        sensorValue=analogRead(GSR);
        temp = threshold - sensorValue;
        if(abs(temp)>50){
        digitalWrite(BUZZER,HIGH);
        Serial.println("YES!");
        delay(3000);
        digitalWrite(BUZZER,LOW);
        delay(1000);}
      }
      }
- Wear the finger stretch and relax, we can see data from Grove_LCD_RGB_Backlight and serial port:
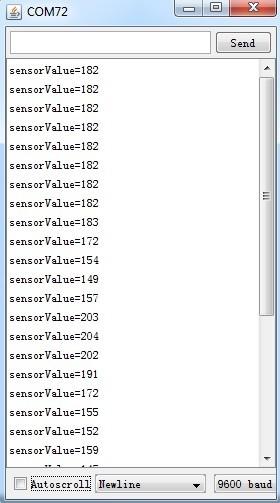
- Then take a deep breath. The buzzer should trigger now. And an obvious change in the output value should be observed.
Reference
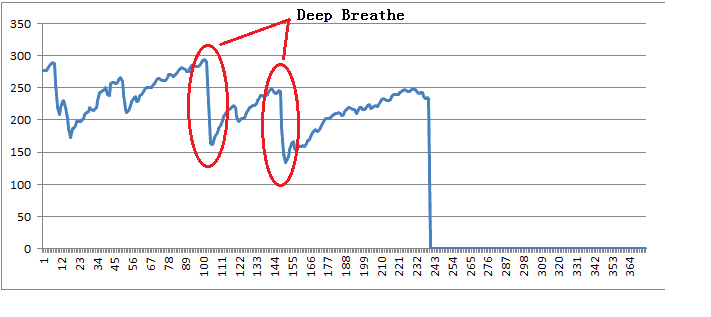
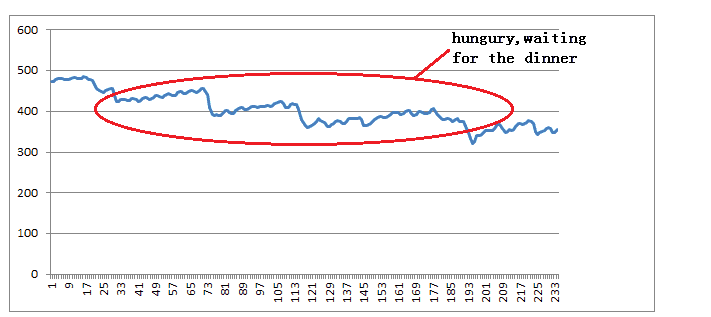
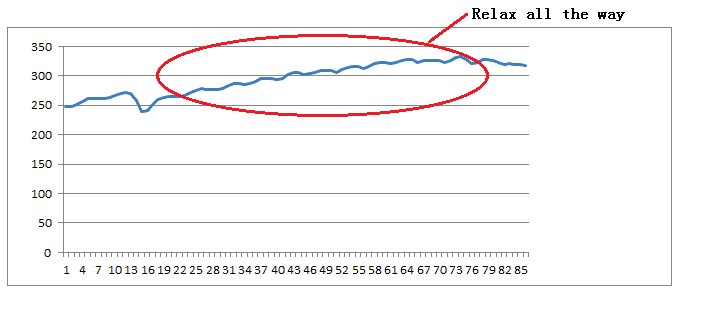
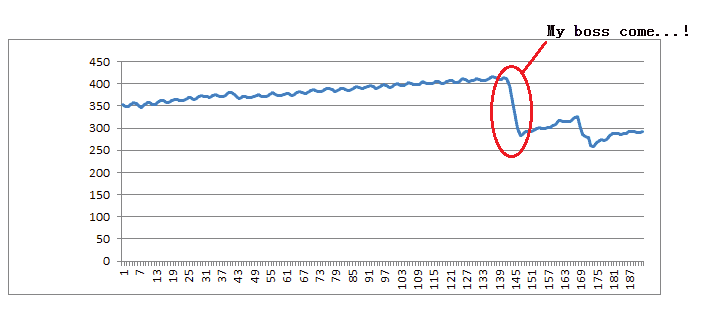
There are several graphs which are created in excel by using GSR data. We can open the GSR sensor data to see the detail data.
-
Deep Breath
-
Hungry
-
Relax
-
My Boss is Coming
Resources
- [Eagle] Grove - GSR v1.0 Eagle File
- [PDF] Grove-GSR v1.0 Sch
- [PDF] Grove-GSR v1.0 PCB
- [Eagle] Grove - GSR v1.2 Eagle File
- [PDF] Grove-GSR v1.2 Sch
- [PDF] Grove-GSR v1.2 PCB
- [Datasheet] LM324 datasheet
- [Document] GSR sensor data
Techsupport
For any technical issue, you are most welcome to contact techsupport@seeed.cc, our techsupport engineers will help you. Thank you!